Docker management
See and control every container across a fleet — status, health, CPU/mem/size, start/stop/restart/recreate/pull, live logs, and alerts — from one screen, with three zoom levels (fleet → instance → app).
SpipCP runs Docker apps as ordinary sites: each Docker app is a site of type
docker, so it gets a port, a domain, and SSL the same way a Node or PHP site does. Docker
management is where those containers are seen and controlled — what's running, whether it's healthy,
how much CPU/memory/disk it uses, start/stop/restart it, stream its logs, and get alerted when one dies
— for every container, in every instance, across every node, from one screen.
Many Docker apps per instance. An instance hosts many sites — including many Docker apps, each with its own port, directory, and route. Two Docker apps in one instance never collide; they sit side by side just like two Node apps would. See Docker site type for how a Docker app is created.
Three zoom levels
| View | Where | What it shows |
|---|---|---|
| Fleet | /docker | Every container, in every instance, on every node, in one table, with a summary strip (running / degraded / failed / total image disk). |
| Instance | instances/$id → Containers | The same table scoped to one instance's apps, plus a summary card on the overview. |
| App | /docker/$id (the container page) | Full container detail, CPU/memory charts, live logs, the app's alert rules, and the lifecycle buttons — its own page, just like a node, instance, or site. Click any fleet row to open it. |
Status — honest, never falsely green
Every container is shown as exactly what Docker reports. A crash-looping, unhealthy, or dead container reads as degraded or failed — never online, never hidden — using the same status chips used everywhere else in SpipCP:
| Container | Status chip |
|---|---|
| running + healthy | online |
| running, health starting | starting |
| running but unhealthy | degraded |
| restarting (climbing) | degraded → failed (a crash loop) |
| exited cleanly (code 0) | stopped |
| exited with an error / dead | failed |
| missing past the grace window | gone (kept, not deleted — last-known is preserved) |
| paused | paused |
A container that should be running but is failed, stopped, or gone fires a down alert. An intentionally-stopped one-shot does not page anyone — only containers that should be running do.
How status is collected
SpipCP refreshes the displayed container state every 30 seconds. It checks every instance that hosts a Docker app (or that already has known containers) and, inside that instance, reads the current state: every container (running or stopped, so a crashed one is never hidden), its detail (health, exit code, restart count, image, sizes), and one CPU / memory / network / disk sample per running container.
It only reads the containers that are actually there, so a busy host is never flooded. Each container is matched to its Docker site; a container with no matching site is shown as ad-hoc — visible, but never a deploy target.
Staleness is not a crash. If a node's connection has dropped, its instances are simply skipped this round — the panel keeps the last-known rows and shows "last seen N ago" rather than wrongly flipping everything to failed. A dropped connection isn't bad container data.
The grace window. When a container disappears, SpipCP does not immediately call it gone — a
single missed check or a brief recreate is normal. Only after a short grace window (about 90 seconds)
does a still-missing container flip to gone, and even then the row is kept (last-known preserved)
rather than deleted, so the history and the down alert still see it.
Lifecycle controls
Each container row has a small set of lifecycle actions. Every one runs the matching docker
command inside the instance, and each is recorded in the audit log — who did what to which container.
The moment the command returns, SpipCP refreshes just that instance, so the row reflects the new state
at once instead of waiting up to 30 seconds for the next refresh.
Because these buttons sit one click away on a busy screen, disruptive actions confirm first.
| Action | What it does | Underlying command |
|---|---|---|
| Start | bring a stopped container back up | docker start <id> (or docker compose -p <slug> start for a Docker site) |
| Stop | gracefully stop a running container | docker stop <id> (compose … stop for a site) |
| Restart | stop and start the same container, same image | docker restart <id> (compose … restart for a site) |
| Recreate | rebuild the container from its current compose file | docker compose -p <slug> up -d --force-recreate |
| Pull (update) | fetch the newest image, then recreate onto it | docker compose -p <slug> pull && … up -d |
| Delete | tear down the whole app — stop & remove the container, remove the app directory, free its port/domain/routes | sites.delete (the same teardown the site workspace runs; optionally drops the database) |
Disruptive actions confirm first. Restart, Stop, Recreate, and Pull & update open a small confirm dialog with a one-line note on what will happen ("the container goes down and stays down until someone starts it again," and so on) before anything runs. Start — the safe one — fires directly. While an action is running the button shows its progress (Restarting…, Pulling…) and the others disable, preventing a second action from firing on top of the first. A toast confirms when it's queued, or shows the real Docker error if it failed. This works the same on the container page and the instance Containers drawer.
Recreate vs restart vs pull
These three look similar but answer different questions, and choosing the wrong one is the most common point of confusion:
- Restart — "turn it off and on again." Same container, same image, same config. Use it to clear a wedged process. Nothing about the app changes.
- Recreate — "apply compose/env edits." After a change to the Compose or Ports tab, recreate throws the old container away and builds a fresh one from the current compose file — but with the image it already has. Use it after editing config, not the image.
- Pull (update) — "get the new image." Pulls the newest image, then recreates onto it. It pulls first, and only recreates if the pull succeeds, so a failed download never takes a running container down. Use it when a new version of the image has been published.
Compose-aware. For a Docker site, Start/Stop/Restart drive the container through its compose
project so compose stays the source of truth, and Recreate/Pull run in the app's own directory so its
docker-compose.yml and .env apply. For an ad-hoc container (one SpipCP didn't deploy),
Start/Stop/Restart act on the raw container — but Recreate and Pull aren't available, because
there's no compose project or app directory to rebuild from. The panel reports this rather than running
the wrong command.
Delete tears down the whole app. Because a Docker app is a site, Delete runs the same teardown the site workspace does — it stops and removes the container, removes the app directory, and frees its port, domain, and routes. A confirm dialog offers a choice to keep or drop the database; keeping it is the default. Delete lives on the container page header (and the fleet kebab, which routes there to confirm), and shows only for an account that can manage sites. An ad-hoc container has no site to tear down, so it has no Delete. This cannot be undone.
Failures are surfaced honestly. If the docker command fails, the action fails with the real
Docker error message (for example "No such container" or a compose error) rather than a generic
"something went wrong" — and nothing is logged or refreshed for an action that didn't actually run.
The message shown is exactly what Docker said.
Live logs
Open a container's page (or the instance Containers drawer) and the Logs tab streams its docker logs
live — the same in-browser tail used for a site's logs. Each line carries its
Docker timestamp, and the output is cleaned up before it reaches the browser. New lines append to the
bottom as they appear rather than re-drawing the whole window.
Restart-safe. If the container is recreated while a tab is watching (a recreate, or a pull + relaunch), its log resets to a fresh stream. The view notices and reloads cleanly — like a rotated log file — so it picks up the new container's output instead of stalling on the old one.
No exact resume on reconnect. A container's log has no fixed position to resume from (unlike a file-backed site log), so reconnecting a dropped Docker log tab re-reads the current window. The latest lines appear immediately, but without the gap-free, no-duplicate resume that a site's file logs give.
Alerting
A container alert fires when a container crosses a configured threshold, and it's sent through the same notification channels already set up for uptime monitoring. The email address and webhook are set once; both uptime checks and Docker containers send through them.
There are six rule kinds, each checked against the latest container state on every refresh:
| Kind | Fires when |
|---|---|
| down | a container that should be running is failed, stopped, or gone |
| restart-loop | the restart count reaches the threshold (default 3) |
| unhealthy | the healthcheck has read unhealthy continuously for at least the window |
| cpu | CPU % is at/over the threshold, sustained across the window |
| mem | memory usage / limit is at/over the threshold ratio, sustained across the window |
| disk | the writable layer + image size is at/over the byte threshold |
Scope — most-specific wins
A rule can be set at four scopes, and for any given container the most-specific matching rule wins: an app rule (a specific Docker site) overrides an instance rule, which overrides a node rule, which overrides a fleet-wide default. This allows one sensible default for the whole fleet, tightened (or relaxed) for a single app without touching the rest.
Only fires for what should be running. The down alert only fires for a container that's expected to be up — a launched Docker site, or a pinned container. An intentionally-stopped one-shot never pages anyone. A paused container, and a container still in its health starting window, are likewise held back across every kind — a deliberate action is never treated as a fault.
Cooldown. After a rule fires it waits out its cooldown (default 15 minutes) — a still-bad container isn't re-sent every 30 seconds. Once the cooldown elapses and the condition still holds, the alert fires again. A failing channel is held back too, so a broken webhook is never hammered.
The fleet view
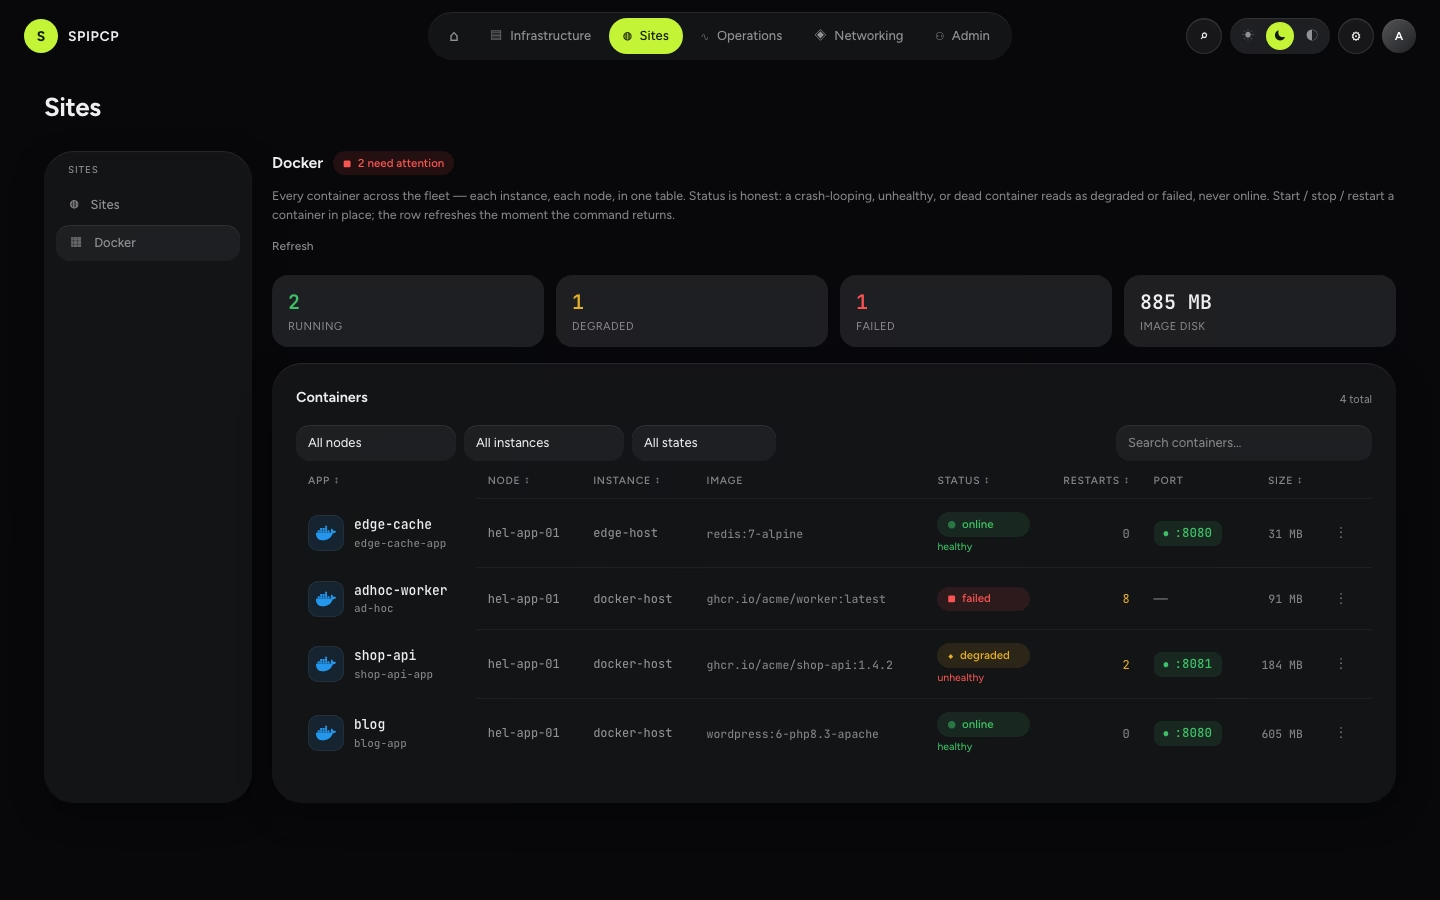
Open Docker in the left nav (under Sites) to reach /docker — the one screen that shows
every container across the whole estate: each instance, on each node, in a single table. This is the
top zoom level; click any row to open that container's own page (/docker/$id) — its full detail,
CPU/memory trend, live logs, lifecycle actions, and alert rules, with a breadcrumb back up to the fleet
and its instance. The App and Instance cells keep their own links (to the site and instance); the rest
of the row opens the container.
The summary strip
Across the top, four tiles give the fleet at a glance, all counted from the same rows the table shows (so the strip and the table can never disagree):
| Tile | What it counts |
|---|---|
| Running | containers reading online |
| Degraded | containers reading degraded (running-but-unhealthy, or restarting below the loop threshold) |
| Failed | containers reading failed or gone |
| Image disk | the total image size across the fleet (the sum of every container's image bytes) |
The page header also carries a single verdict badge — all healthy when nothing is degraded or failed, or N need attention (red when any container is failed) otherwise.
The table
Each row is one container, joined to its node, instance, and — for a Docker site — its site:
| Column | Shows |
|---|---|
| App | the Docker logo, the site name (linked to its workspace) or the container name; ad-hoc below it when the container is not a SpipCP deploy |
| Instance | the instance hosting it (linked to its workspace), with the node name folded underneath (instance → node is implied; the node's own page has the detail) |
| Image | the image reference (wordpress:6-php8.3-apache, redis:7-alpine, …) |
| Status | the honest status chip — never falsely green (see Status above), with the Docker healthcheck verdict folded beneath it (only shown when the image declares a healthcheck) |
| Restarts | the restart count (amber when above zero) |
| Port | the published host port, as a live data chip |
| Size | image + writable-layer bytes (hover for the breakdown) |
| Actions | the ⋮ kebab menu — only shown to a user who can manage (see below) |
CPU and memory live on the container detail, not the fleet row. Reading CPU and memory for every container on every render would be needless load, so the fleet table shows size + status here. The CPU/memory charts live on the container page (and its drawer), read on demand for the one opened container.
Filtering and search
Above the table, three dropdowns — node, instance, and state — narrow the fleet to exactly what's needed (for example, every failed container on one node), and the search box matches by container name, site, image, node, or instance. The filters are instant, so a large fleet stays responsive.
Lifecycle controls
The Actions column is a single ⋮ (kebab) menu per row — a compact dropdown that keeps the table tight. It shows only for an account that can manage sites; an operator with read-only Docker access sees the whole fleet and its health, but not the controls. The menu offers Restart / Stop (or Start when the container is down), plus Recreate and Pull & update for a Docker site container — an ad-hoc container has no compose project to recreate, so those two are left out. Choose an action and the moment it returns the row refreshes to show the new state. The same menu and full set of actions also appear on the container page and its drawer.
The instance Containers tab
The fleet view is the whole estate at once; when working on one instance, open it and switch to its Containers tab. It's the same table as the fleet view but scoped to a single instance — exactly the containers running on that box, nothing else — so a Docker app can be launched and watched as it comes up without the rest of the fleet in the way.
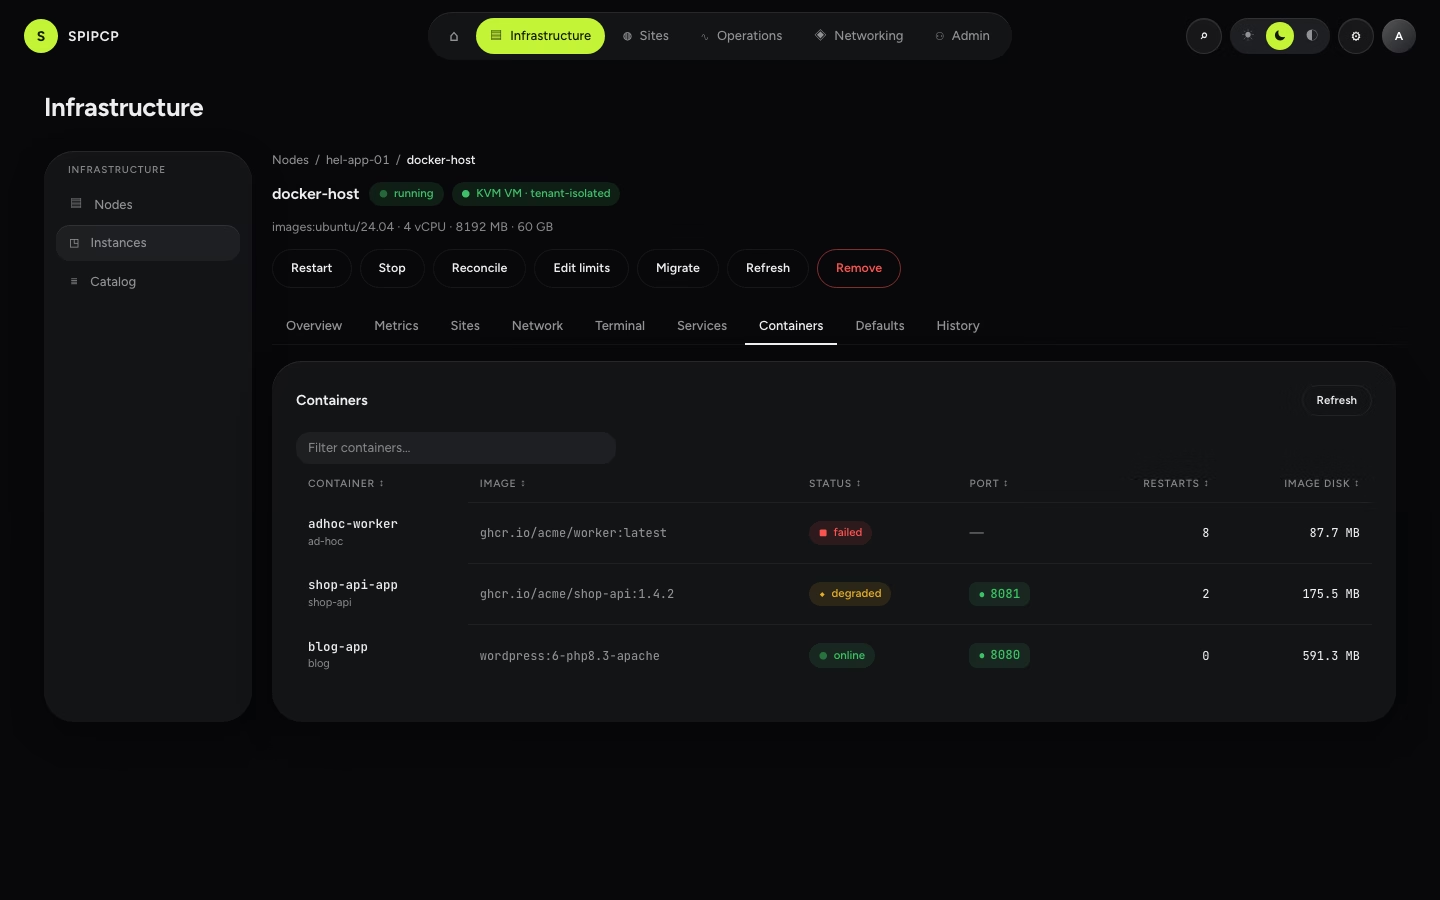
The tab is only present for an account that can view Docker; an account without that access never sees it (developers never do). The columns mirror the fleet table — container (with its site name, or ad-hoc when it isn't a SpipCP deploy), image, the honest status chip, the published port, restarts, and image disk — with filtering by name, image, site, or status. Click any row to open that container's app drawer.
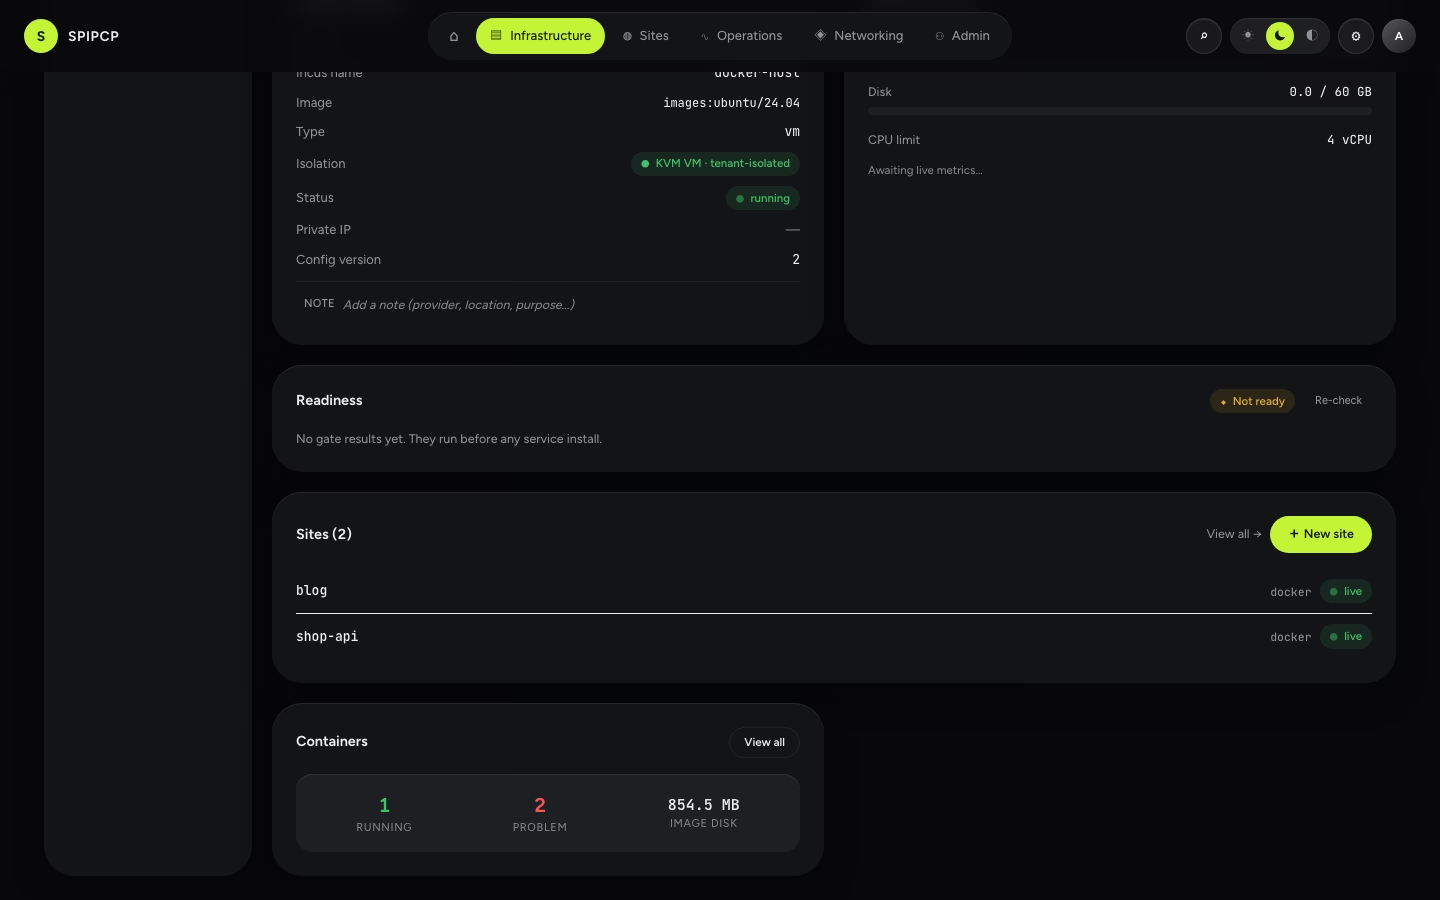
The instance Overview also carries a small Containers summary card — running / problem / image disk for just this instance — but only when the instance actually hosts containers, so a plain (non-Docker) instance's overview stays uncluttered. View all jumps to the Containers tab.
The container page
Clicking a row on the fleet view opens that container's own page (/docker/$id) — a full
workspace just like a node, instance, or site: a breadcrumb back up to Docker and its instance, the
honest status chip and the lifecycle actions in the header, and tabs (Overview · Logs · Alerts) below.
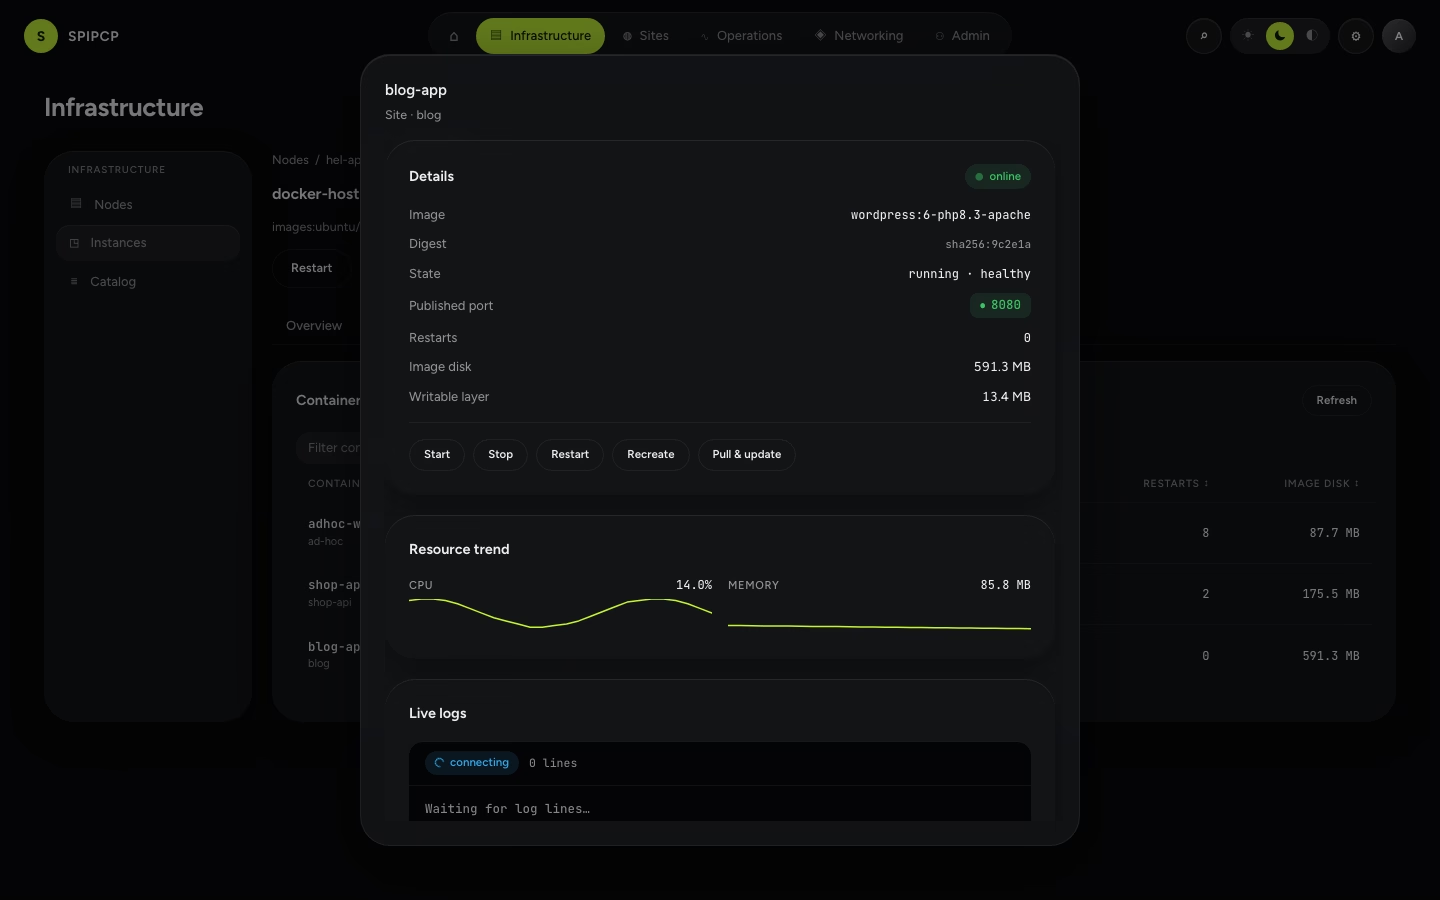
It's bookmarkable. The instance Containers tab opens the same content in a drawer when
already focused on one instance — page or drawer, it's the deepest zoom level, everything about one
container on one screen:
- Details — the container's header: image and digest, raw state + health, published port, restart count, and the image / writable-layer sizes, with the honest status chip beside the title.
- Resource trend — the CPU and memory charts, drawn from the samples taken on each refresh (about the last hour). The memory chart is scaled to the container's memory limit when one is set. Before any samples exist (a just-launched container), the section shows a short note rather than an empty chart.
- Live logs — the in-browser tail described under Live logs above.
- Alert rules — the app-level alert rules for this container's Docker site: list, enable/disable, delete, and add a rule (kind, channel, target, threshold). Editing rules needs the right access; a read-only viewer sees the rules but not the controls. An ad-hoc container has no site, so this section explains that per-app rules don't apply to it.
- Lifecycle — the full start / stop / restart / recreate / pull controls (shown only for an account that can manage sites). On the page they sit in the header; in the drawer they're a button bar. Each runs the matching action and the view refreshes as it advances.
The detail reads once on open. It fetches the container's detail and its samples on open (and again after any lifecycle action). The continuously-live piece is the log tail; the numbers are a snapshot of the last refresh, so a value is at most one 30-second cycle old.
What's next
- Docker site type — creating a Docker app and editing its compose/ports.
- Uptime monitoring — the notification channels Docker alerts share.