Monitoring
SpipCP watches the fleet and reports when something goes down — and again when it recovers — with uptime checks, certificate-expiry alerts, and email or webhook notifications.
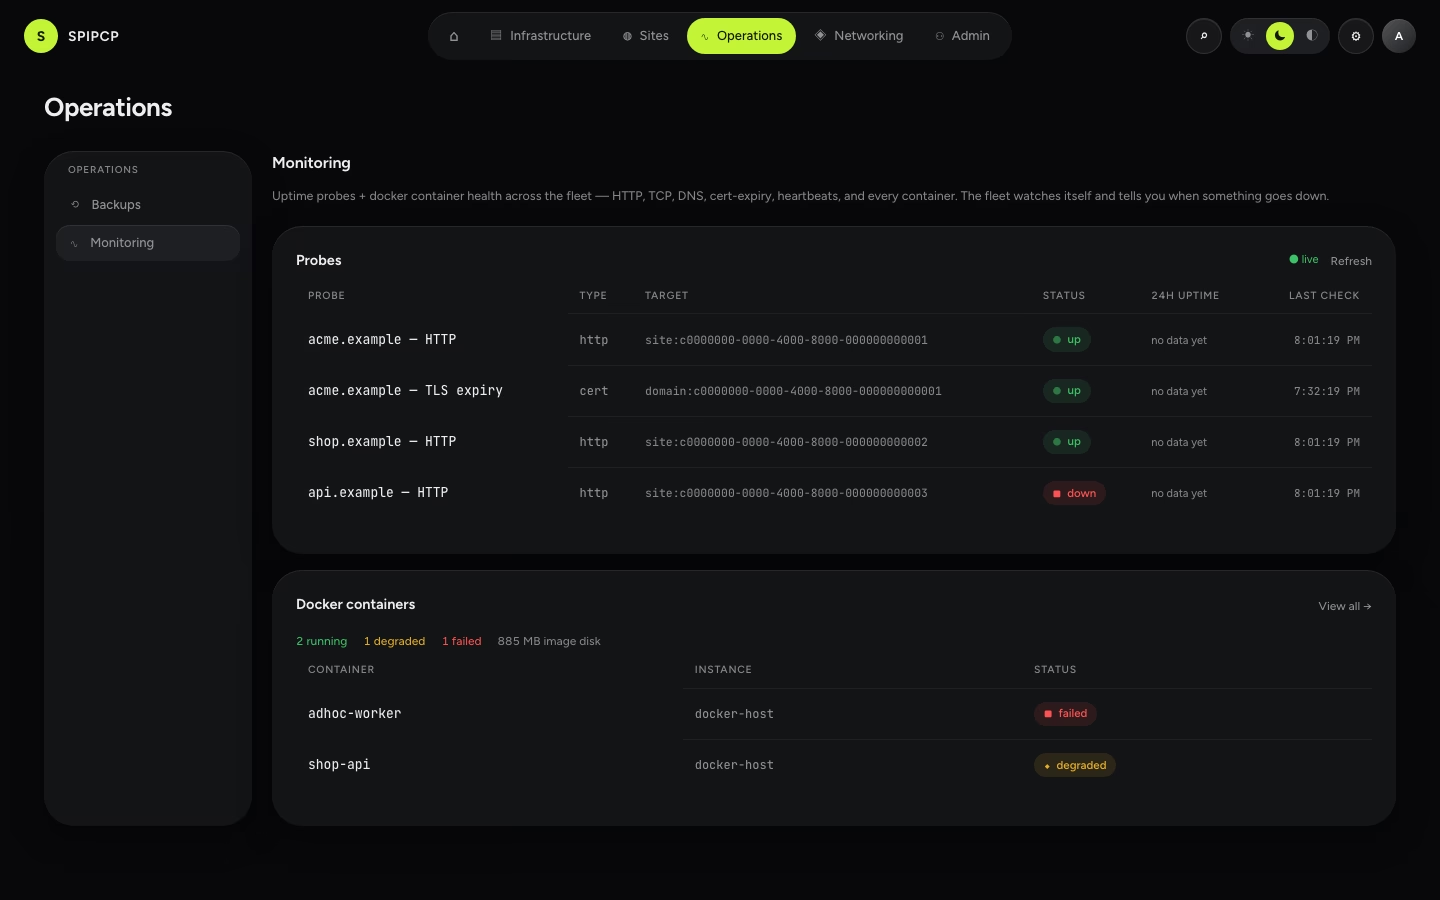
Monitoring watches the fleet continuously. A probe is a periodic check on something worth watching — a site URL, a host and port, a hostname, a certificate, or a heartbeat. When a probe changes state, a notification goes out. Brief blips are held back so a momentary flap doesn't become an alert storm. In short: report when a site is down, and again when it's back.
Probe types
| Type | Checks that… | Target |
|---|---|---|
| HTTP / keyword | a URL responds (optionally containing a keyword) | a site URL |
| TCP | a port accepts a connection | host:port |
| DNS | a hostname resolves | a hostname |
| Cert-expiry | a certificate is present and not expiring soon | a hostname |
| Heartbeat | something checked in within its interval (a dead-man's-switch) | a pinged token |
Probes appear automatically
These don't need to be wired up by hand: enrolling a node creates a heartbeat probe, launching a site creates an HTTP probe on its URL, and attaching a domain adds a certificate-expiry probe. Custom probes can be added any time.
Notifications
When a probe goes down or recovers, SpipCP sends a notification by email and/or a signed webhook. Notifications cover real outages, not flaps: a brief blip is held back, one alert fires when something is genuinely down (with optional reminders while it stays down), and a clear "recovered" notice fires when it returns.
Each probe has its own contact rules — recipients, a cooldown that holds back brief blips, and an optional repeat-while-down reminder — configured per check, not as one global switch.
| Setting | What it does |
|---|---|
| Channels | Email and/or a signed webhook URL. |
| Cooldown | Hold back alerts for brief blips. |
| Repeat-while-down | Optional reminders until the target recovers. |
Health, per resource
Every node, instance, and site has a Health view — the same checks, scoped to that one resource — showing a single site's uptime without scanning the whole fleet. For an HTTP probe, Health also shows latency percentiles and a response-status chart — see Analytics.
→ Email setup: Settings → Email. · Per-site view: Sites → Monitoring. · Charts & trends: Analytics.
Instance migration
Move a whole instance — the container/VM and every site in it — to another node or another provider, with snapshot consistency, resumable streaming, and an automatic rollback if the destination fails its health check.
Analytics
SpipCP turns the fleet from a state console into an observability console — real, modern, time-series charts on the dashboard, and on every node, instance, and site.