Analytics
SpipCP turns the fleet from a state console into an observability console — real, modern, time-series charts on the dashboard, and on every node, instance, and site.
Analytics is the fleet's memory. Instead of just showing what a node, instance, or site is right now, SpipCP keeps a history — CPU, memory, disk, load, uptime, latency, and activity — surfacing the trend, not just the snapshot. Every chart is read-only: nothing here can change the fleet, it only shows what it's been doing.
The dashboard: mission control
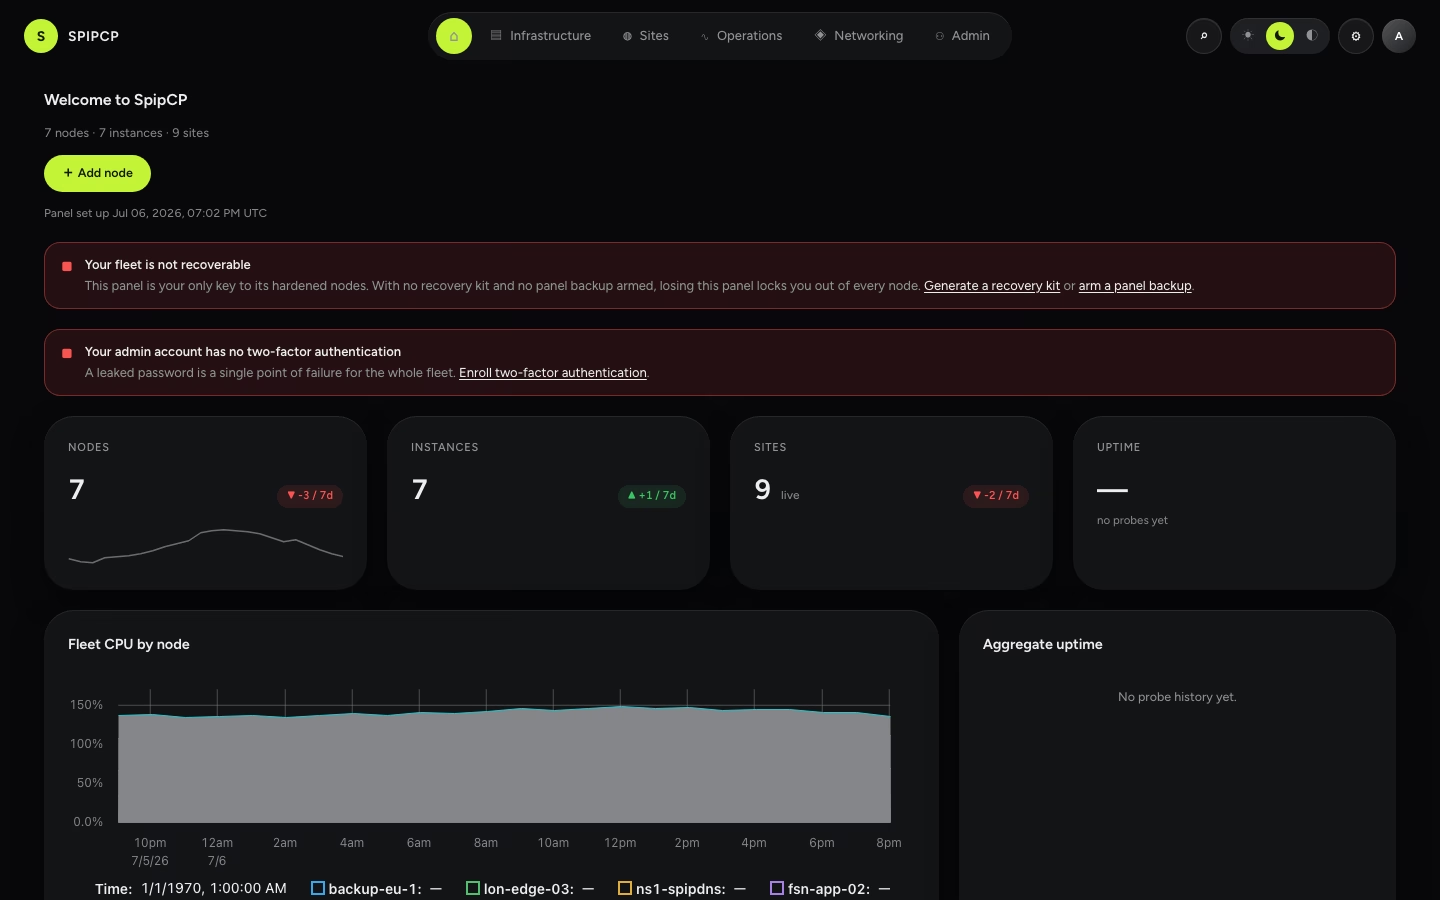
Once the fleet has nodes, the dashboard becomes a mission-control view instead of the first-run checklist:
- Fleet tiles for Nodes, Instances, and Sites gain a sparkline and a delta chip — a real comparison against the prior 7 days, not a static count.
- A fleet CPU by node chart stacks every node's usage, showing which one is hottest.
- An aggregate uptime gauge summarizes uptime across every probe in the fleet.
- An incidents list shows any probe that's currently down or degraded.
- An activity chart shows audit-log volume per day.
The dashboard refreshes itself every 60 seconds, so it's safe to leave open on a screen. An empty fleet still shows the first-run checklist — analytics only appears once there's something to chart.
Node Metrics
Where: Node workspace → Metrics tab.
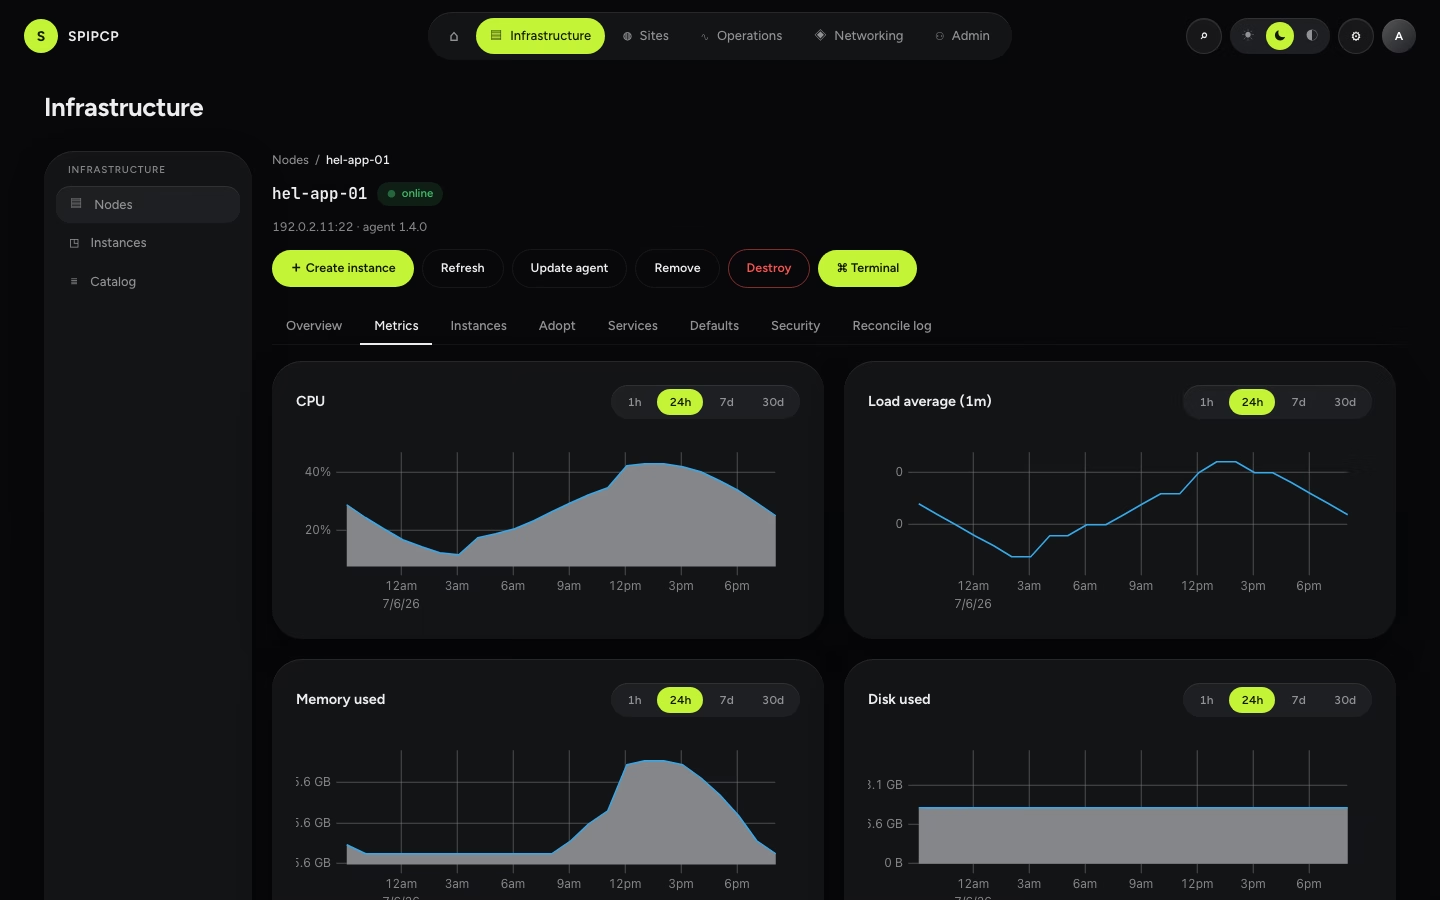
CPU, load average, memory, and disk trends for the node, each with the same range picker (1h · 24h · 7d · 30d) — the selected range decides how the chart reads its history, so a wide range never scans raw data. An online-history strip shows when the node has checked in over the last day, and three capacity gauges compare what's allocated to instances against the node's real CPU, memory, and disk.
Instance Metrics
Where: Instance workspace → Metrics tab.
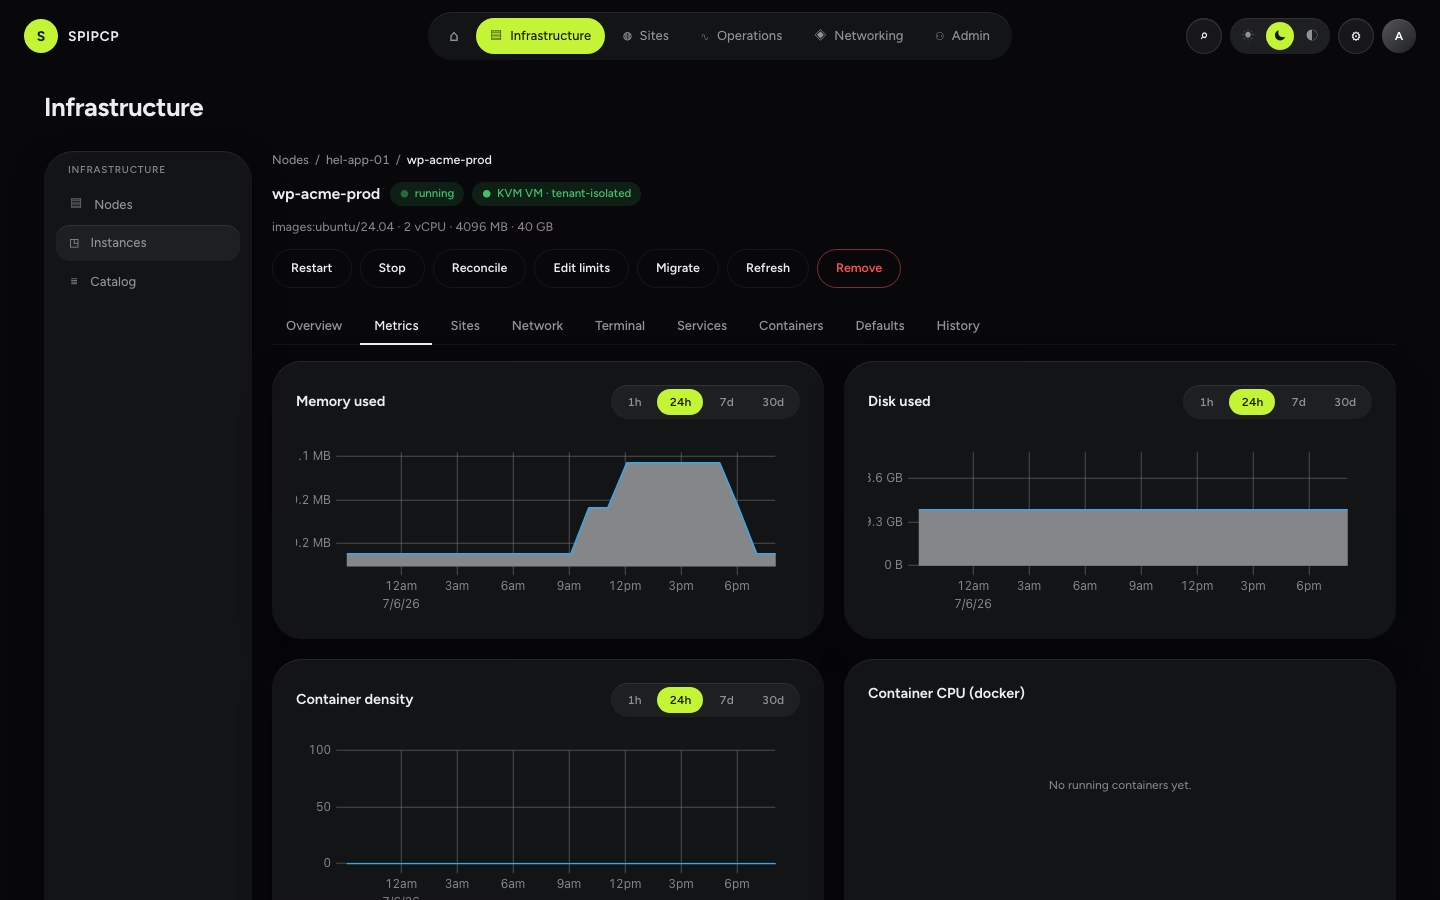
Memory and disk trends, a container-density chart (how many containers have been running over time), and a readiness-history strip. If the instance hosts Docker containers, a per-container CPU breakdown shows which app is using what — reusing the same container stats Docker management already collects.
Site analytics
Where: Site workspace → Monitoring tab → Health, and the Deploys / Backups tabs.
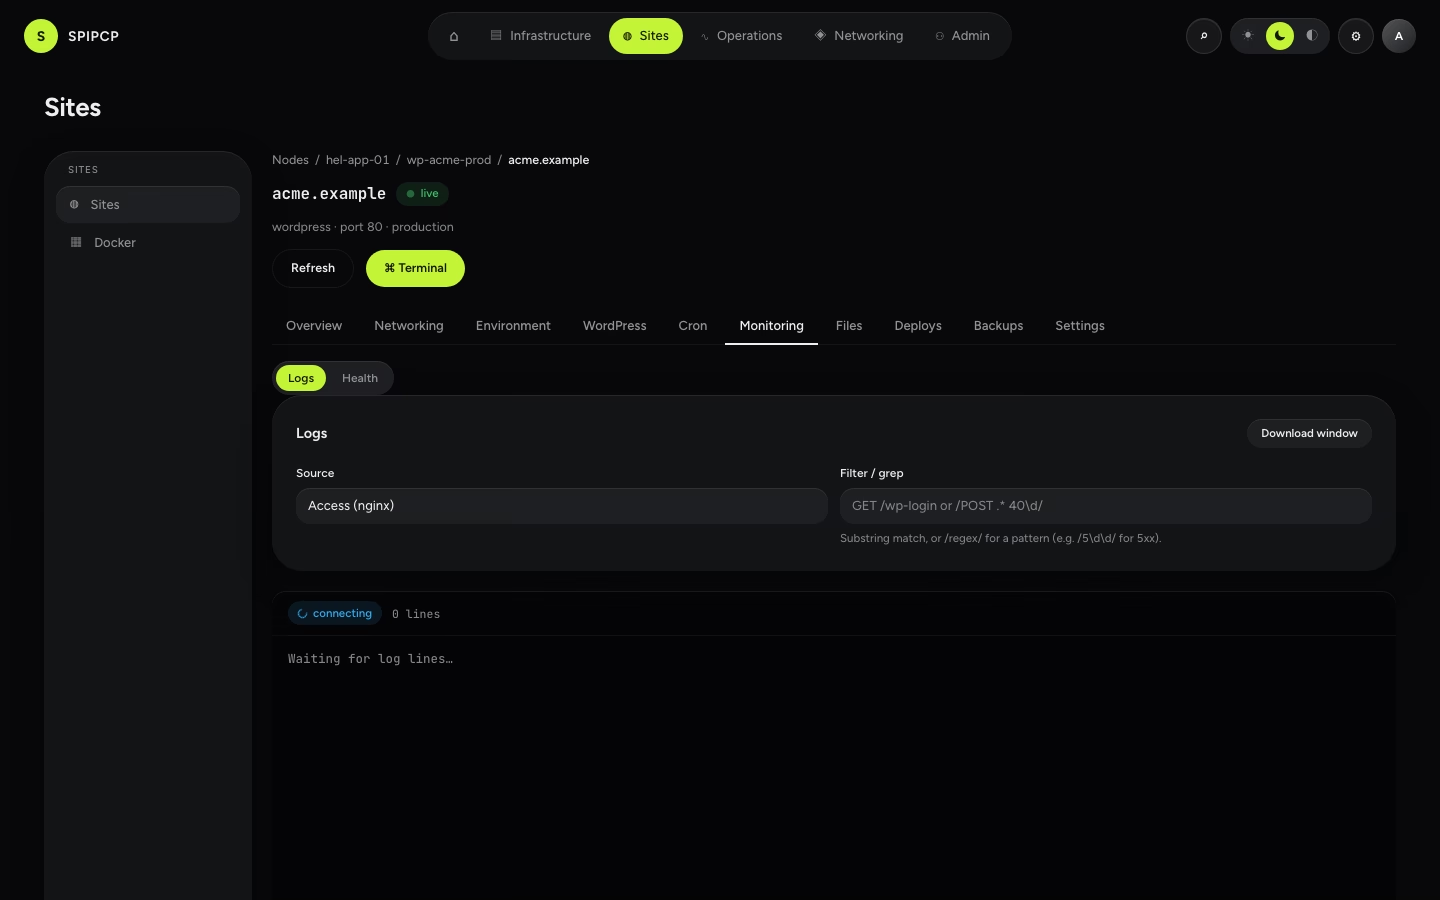
A site's health view keeps its uptime sparkline and adds, for an HTTP probe:
- Latency percentiles (p50/p95) over the last 24 hours.
- A response-status chart — how many 2xx responses landed per day.
The Deploys tab gets a deploy timeline — each run's duration and outcome, so a deploy that's crept slower over time (or a run of failures) stands out. The Backups tab gets a backup-health chart tracking size alongside the success rate.
Backups analytics
Where: Backups page → Analytics tab.
Three fleet-wide numbers — dedup ratio, drill pass-rate, and retention headroom — plus a backup-size-by-site chart. See Backups → Analytics for the full breakdown.
Activity analytics
Where: Settings → Audit log.
Volume-per-day, the top 10 actions, and the top 10 actors over the last 30 days — a fleet-wide view of who's doing what. See Settings → Audit log.
How the history is collected
Every chart reads from the same generic metrics-history table, modelled on the same raw → hourly → daily rollup pattern Monitoring already proves for uptime checks. Nothing here adds a new poll or a new agent capability — recording a sample rides the refresh jobs the panel already runs:
- A node's CPU, memory, disk, and load ride its existing heartbeat (roughly every 60 seconds).
- An instance's memory, disk, and readiness ride its existing runtime refresh.
- A Docker instance's container count and per-container stats ride the existing Docker fleet poll.
Charts are read-only
No chart here can change the fleet. Every analytics procedure is a read — clicking a chart never triggers an action. If a metric has no history yet (a freshly-enrolled node, a site with no backups), the chart honestly says "no data yet" instead of showing a fabricated line.
An hourly cron rolls raw samples into hourly, then daily, aggregates, and prunes old raw/hourly rows once they're no longer needed — retention for each window is configured in Settings → Metrics. A short range (1h) reads raw samples directly; a wide range (30d) reads daily rollups, so a chart never scans more data than needed.
→ Retention settings: Settings → Metrics. · Uptime & probes: Monitoring.
Monitoring
SpipCP watches the fleet and reports when something goes down — and again when it recovers — with uptime checks, certificate-expiry alerts, and email or webhook notifications.
Site metrics
CPU, memory, task count and disk for one site — measured from the site's own systemd unit, not apportioned from the instance.