Site metrics
CPU, memory, task count and disk for one site — measured from the site's own systemd unit, not apportioned from the instance.
A site's Monitoring → Metrics view charts what that one site is using: CPU, memory, tasks and disk, over a range picked at the top of each chart.
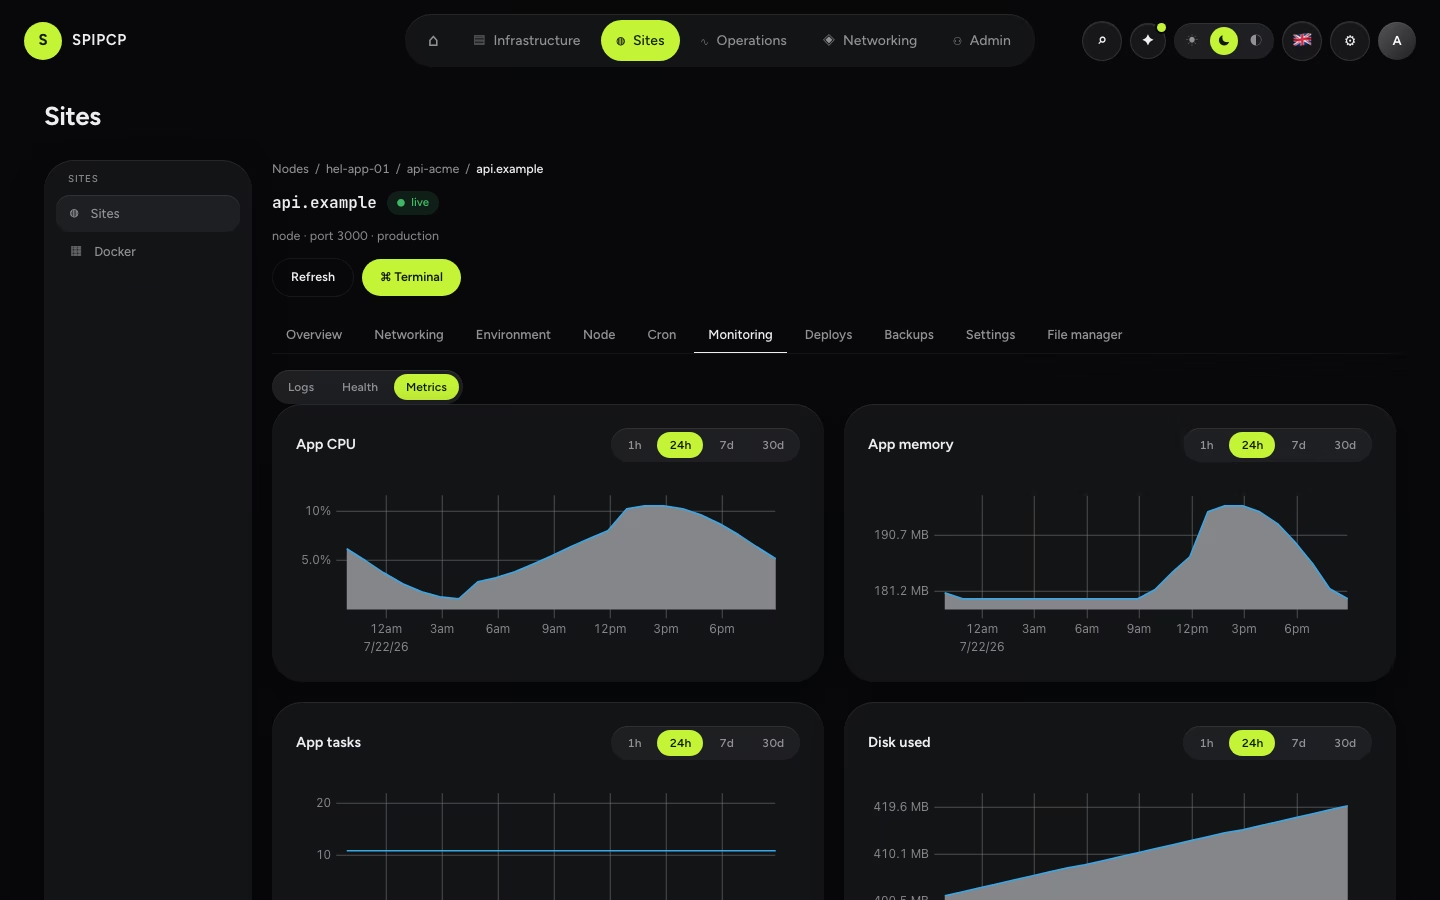
What is measured, and for which sites
| Site type | CPU · memory · tasks | Disk |
|---|---|---|
| Node, Python, Go, Rust | Yes | Yes |
| WordPress, PHP, static | No — see below | Yes |
| Docker | No — see below | Yes |
The four app types each run as their own systemd unit, and a unit is a cgroup: the kernel is already accounting for exactly the processes belonging to that site. The figures come from that accounting directly, so they are measurements rather than estimates.
A WordPress or PHP site runs inside a shared PHP-FPM pool, and a Docker site inside container runtimes. Splitting either of those per site would mean apportioning a shared total, which produces a number that looks precise and is not. Those pages say so rather than showing a dash that implies a figure is on its way. Instance-level CPU and memory — which are measured — remain on the instance page.
CPU is a rate, not a counter
The underlying value systemd reports is cumulative CPU time since the unit started. Charting that would show a line that only ever goes up. What is recorded instead is the change between two readings divided by the time between them, expressed as a percentage of one core.
Two consequences worth knowing:
- Above 100% is normal and correct. A unit using several threads on several cores really does consume more than one core's worth. The figure is not clamped, because clamping would hide exactly the site that is loading the box.
- Some ticks record nothing at all. The first reading of a series, a restart (the counter starts over), and any gap wide enough that an average would not describe what happened inside it are all recorded as no sample. The chart shows a gap.
Nothing is never drawn as zero
A missing sample and a measured zero are different facts, and the charts keep them apart. An app
that is genuinely idle charts a flat zero. An app whose unit is stopped, or whose instance was
unreachable, charts nothing — because "this site used no CPU" is a claim, and it was not measured.
Memory works the same way: if cgroup memory accounting is off on a box, no memory sample is
recorded rather than a misleading 0 B.
How often, and at what cost
The runtime sweep runs about once a minute — a rate needs two readings close together — and reads every site on an instance in a single round-trip, so an instance carrying six sites costs the same as one carrying one. Disk is measured separately and far less often (every twenty minutes), because walking a directory tree is real I/O and a site's size moves slowly.
Both sweeps stand aside for a node that is busy with operator work: a launch, a deploy or a migration in flight means the node is skipped that tick. A background measurement is never worth slowing down a change someone is waiting on.
The cgroup is the boundary
Only processes inside the site's unit are counted. That is the useful property — it is what makes the number specific to one site — and it has one consequence worth stating plainly: an app started outside the unit, for example by a process manager that daemonizes it, leaves that cgroup and is measured by nothing here. It also loses restart-on-failure, reboot survival and the Logs view. See Node sites for why no separate process manager is needed.
Retention
Site series use the same storage as every other chart in the panel: fine-grained samples for the last two days, hourly averages for a month, daily averages for a year. The range picker chooses the resolution automatically, so a wide range never reads raw history.
→ Fleet and node charts: Analytics. · Live output: Logs. · Uptime checks: Monitoring.
Analytics
SpipCP turns the fleet from a state console into an observability console — real, modern, time-series charts on the dashboard, and on every node, instance, and site.
Site logs
Tail a site's access, error, and app logs live from the panel — filter/grep client-side, export the watched window, and resume a killed tail from its exact byte offset with no gap and no duplicate.